What is Campsis?
Introduction
Campsis is an open-source PK/PD simulation platform built on top of
the simulation packages rxode2 and mrgsolve.
It provides an abstraction layer over the underlying processes of
writing a model, assembling a dataset and running, in the background, a
simulation with these packages.
Campsis is developed by software engineers working at Calvagone and designed for pharmacometricians who are looking for an easy and intuitive way to run model-based simulations. The packages are developed in R, which makes it possible to integrate your simulation into an R workflow.
More broadly, Campsis is part of a larger ecosystem of packages, called the Campsis suite. The goal of this suite is to provide a comprehensive set of tools to help pharmacometricians to build, run and analyze simulations. A short introduction to these packages is given below.
Campsis family
As shown in the schematic below, Campsis plays a central role in the
Campsis suite, as it is the package that orchestrates the simulation
process. While the package campsismod
takes care of the pharmacometric model and its translation to rxode2 or
mrgsolve, the campsis
package is more focused on the creation of the dataset (study design)
and the simulation process.
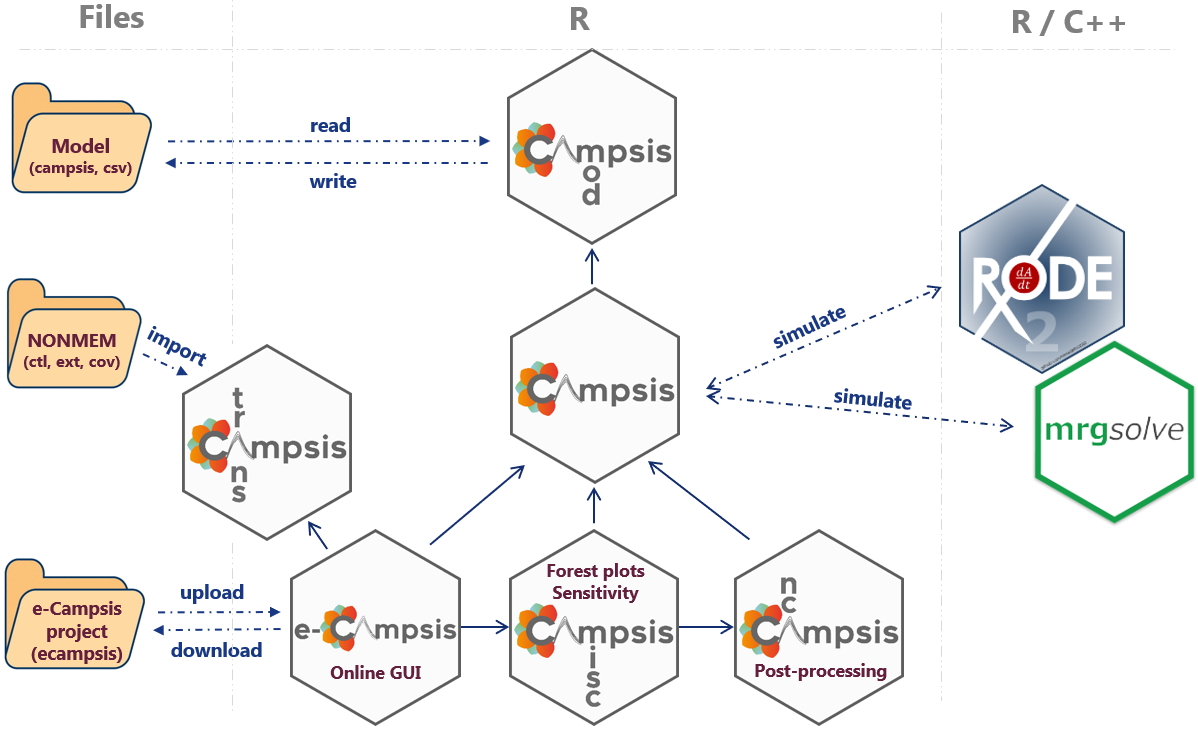
In addition to these two interconnected core packages, the Campsis
suite includes additional packages for post-processing and analysis. The
first package, campsisnca,
specializes in non-compartmental analysis (NCA) of simulation results.
The second package, campsismisc,
provides various utilities tailored for pharmacometricians. Among its
key features are forest plots, which visualize the uncertainty of
covariate effects on model parameters or NCA metrics, and tornado plots,
which illustrate the sensitivity of model parameters to NCA metrics.
These additional packages enhance the capabilities of the Campsis suite,
making it a versatile set of packages for pharmacometric analysis.
Moreover, Calvagone has developed e-Campsis, a graphical user interface that
builds on the capabilities of the existing Campsis packages. e-Campsis
streamlines simulation setup and execution, offering an interactive
platform for result visualization. Users can also export complete
simulation scripts for offline execution using the open-source Campsis
suite.
Additionally, e-Campsis features a model importer, enabling users to
import and simulate NONMEM, Monolix and rxode2 models seamlessly. This
functionality is based on the campsistrans package which leverages the
monolix2rx
and nonmem2rx
packages developed by Matt Fidler.
A quick example of Campsis
Load a 1-compartment model with absorption compartment from the model library.
For instance, let’s adapt the population estimate for clearance.
Assume some drug is already present in the central compartment (e.g. 0.1 ng/mL with 20% CV across individuals).
model <- model %>%
  add(Theta(name="CENTRAL_INIT", value=0.1)) %>%
  add(Omega(name="CENTRAL_INIT", value=20, type="cv%")) %>%
  add(InitialCondition(compartment=2, rhs="THETA_CENTRAL_INIT*exp(ETA_CENTRAL_INIT)*V"))
Let’s now create a small dataset of 10 individuals and let’s infuse 100 mg at time 0, for a duration of 10 hours.
dataset <- Dataset(10) %>%
  add(Infusion(time=0, amount=100, compartment=1, duration=10)) %>%
  add(Observations(0:24))
We can now simulate this very simple model and dataset.
Finally, we can use ggplot2 to plot these results.
library(ggplot2)
ggplot(results, aes(x=TIME, y=CONC, group=ID)) +
  geom_line(colour="gray39", linewidth=1) + theme_bw()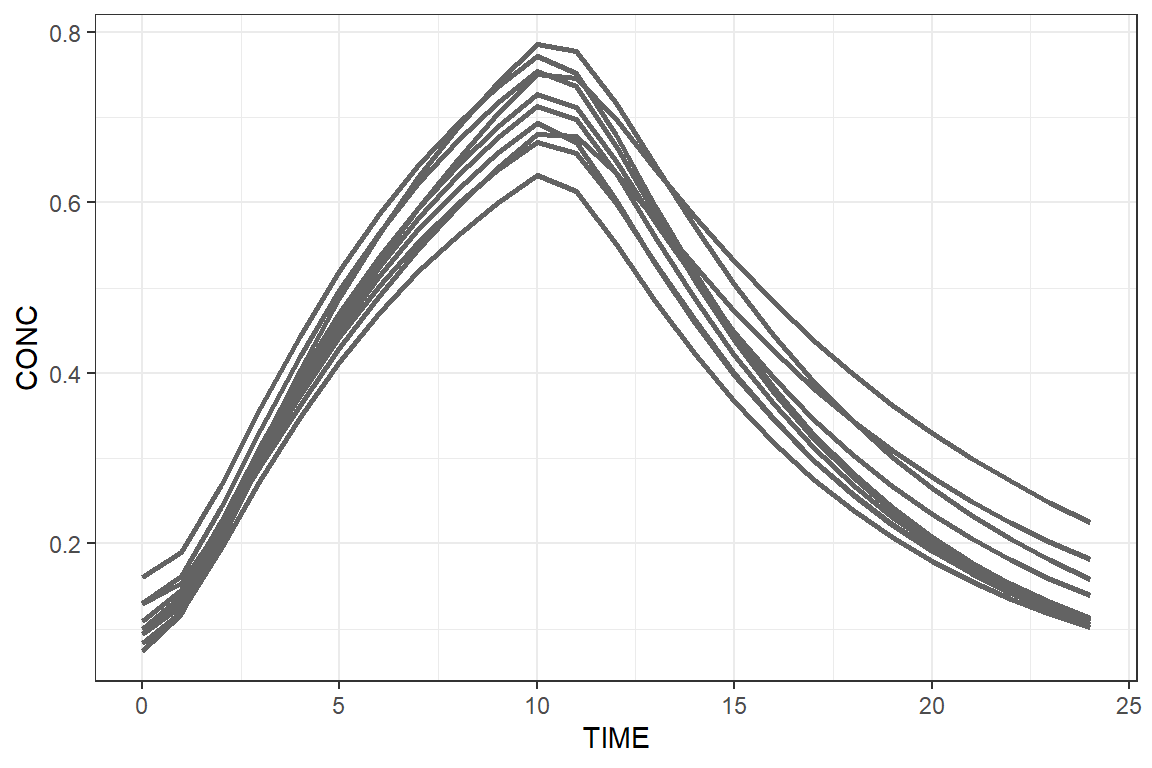
Well done, you just drew the A letter of our Campsis
logo.
Going further
If you haven’t installed Campsis, please visit the installation section.
If you are looking for some more examples, please check out our documentation websites or READMEs:
- Package
campsismod - Package
campsis - Package
campsisnca - Package
campsismisc
If you want to try out e-Campsis, please visit the e-Campsis section.
If you want to know more about our quality assurance process, please visit the Quality section.